Measures that matter
Vous souhaitez remporter un projet comme celui-ci ?
Ce client a reçu 3 designs graphiques de la part de 2 designers. Il a choisi ce design graphique de moreslides comme design gagnant.
Inscrivez-vous Trouvez des Projets de Design- Garanti
-
 A$490
A$490
-
 3 designs
-
 2 designers
Brief de Design Graphique
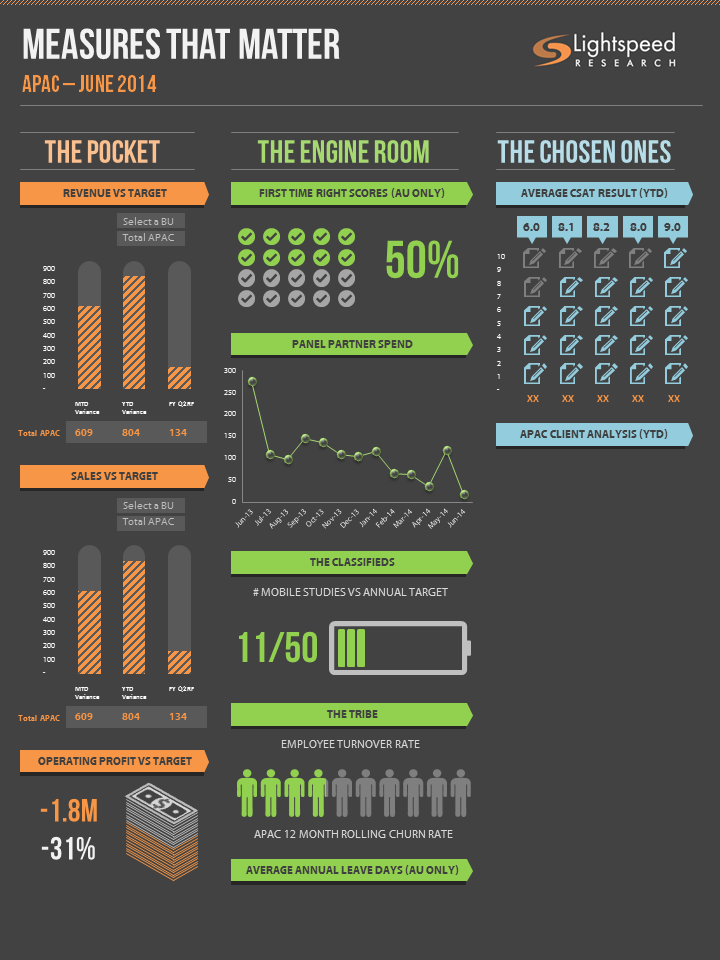
An internal dashboard of regular company results but with a twist!
No boring stats need apply- we want this to be visual and easy to digest for all staff on a monthly basis.
For instance, instead of a pie chat depicting the number of mobile projects won, make this a mobile charge icon ie 10 out of 50 = a fifth of charge. Or for churn rate of employees leaving the company, instead of a bar chart show 2 out of 10 people icons to show 20%.
This is built from a spreadsheet where formulas and pull throughs are already set so functionality needs to be intact.
There is one measure where there is a drop down filter, this should remain as a bar chart but be jazzed up as much as possible.
Branding elements and colours shown in the spreadsheet template, also attached is an example presentation so that you can gauge the brand tone.
Hoping for some awesome ideas here- let's show finance that design and marketing make a massive impact!
Mises à jour
Project Deadline Extended
Added Sunday, July 27, 2014
Project Deadline Extended
Reason: Really hoping for some clever ideas on this one so extending the deadline.
Added Friday, August 01, 2014
Hi Creative Minds!
Really hoping to get your help on this project- a spreadsheet may seem daunting but it can be a really fun and visual project.
Please let me know if you can help.
Added Wednesday, August 06, 2014
Project Deadline Extended
Added Monday, August 11, 2014
Project Deadline Extended
Added Wednesday, August 20, 2014
Secteur / Type d'entité
Marketing
Styles de police à utiliser
Autres polices appréciées:
- Century Gothic