Power Point Showing our WHY: P2C
Vous souhaitez remporter un projet comme celui-ci ?
Ce client a reçu 13 designs de PowerPoint de la part de 4 designers. Il a choisi ce design de PowerPoint de pb comme design gagnant.
Inscrivez-vous Trouvez des Projets de Design- Garanti
-
 US$220
-
 13 designs
-
 4 designers
Brief de Design de PowerPoint
Project Description:
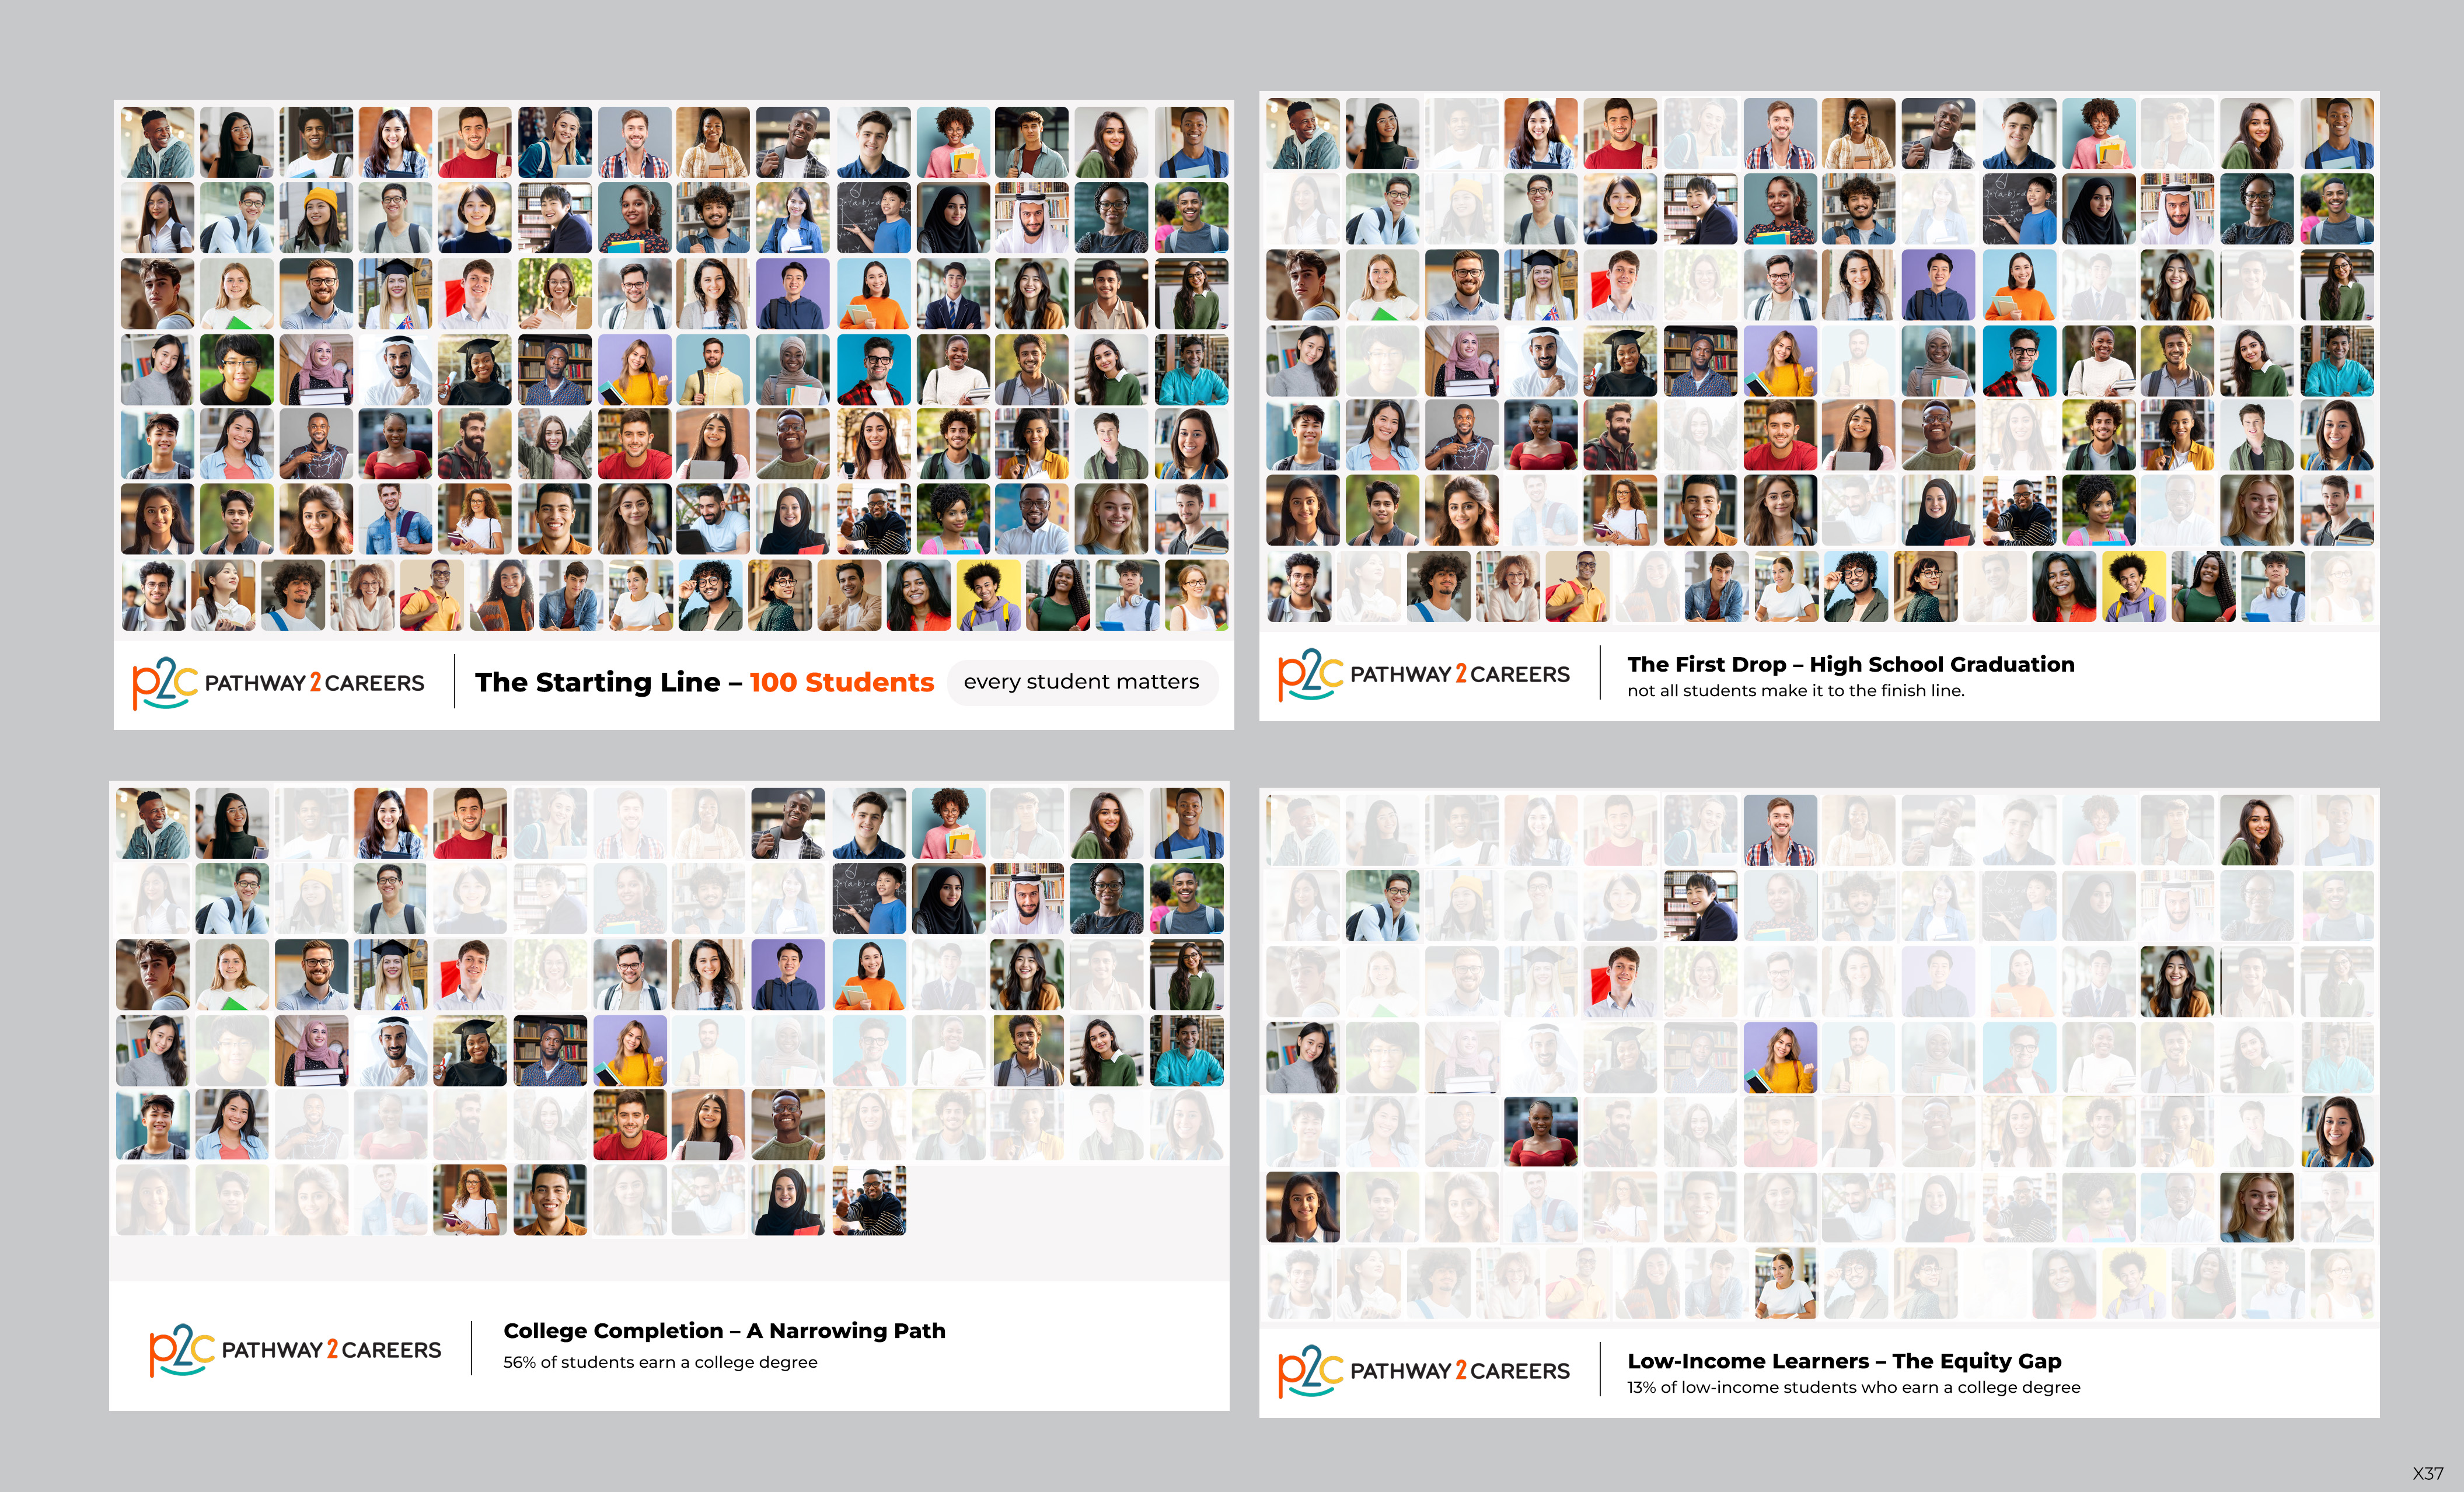
This PowerPoint design project aims to humanize critical educational statistics by transforming data into a powerful visual narrative. The goal is to put a face to the data, making abstract percentages more tangible and emotionally resonant for audiences.
The presentation begins with a single, impactful visual: 100 K–12 students, diverse in race and ethnicity, representing the full spectrum of learners across America.
Slide Progression & Visual Design:
Slide 1: "The Starting Line – 100 Students"
A visual display of 100 illustrated or photographic K–12 students.
Representation includes diversity in race, ethnicity, gender, and clothing to reflect real classrooms.
This slide sets the stage: every student matters.
Slide 2: "The First Drop – High School Graduation"
20 students fade away, showing the stark reality that only 80% graduate from high school.
Remaining 80 students stay on screen, reinforcing the message: not all students make it to the finish line.
Slide 3: "College Completion – A Narrowing Path"
From the 80 remaining students, another 35 fade away, illustrating that only 56% of students earn a college degree.
This leaves 45 students visible, showing the significant drop-off even after high school graduation.
Slide 4: "Low-Income Learners – The Equity Gap"
The image resets to the original 100 students.
This time, 87 students fade away, leaving only 13 standing, representing the 13% of low-income students who earn a college degree.
The emotional impact is amplified by the dramatic reduction in students who overcome economic barriers.
Design Notes:
Use consistent character illustrations or silhouettes for cohesion.
Employ subtle animations for "fading out" to enhance storytelling.
Slides should have minimal text—statistics should be overlaid in bold, clean typography.
Backgrounds should remain neutral or slightly muted to keep the focus on the students.
I am including out template to use
Mises à jour
Need a couple of days before selecting a winner