Quality performance report
Vous souhaitez remporter un projet comme celui-ci ?
Ce client a reçu 25 designs de PowerPoint de la part de 8 designers. Il a choisi ce design de PowerPoint de moreslides comme design gagnant.
Inscrivez-vous Trouvez des Projets de Design- Garanti
-
 C$400
C$400
-
 25 designs
-
 8 designers
Brief de Design de PowerPoint
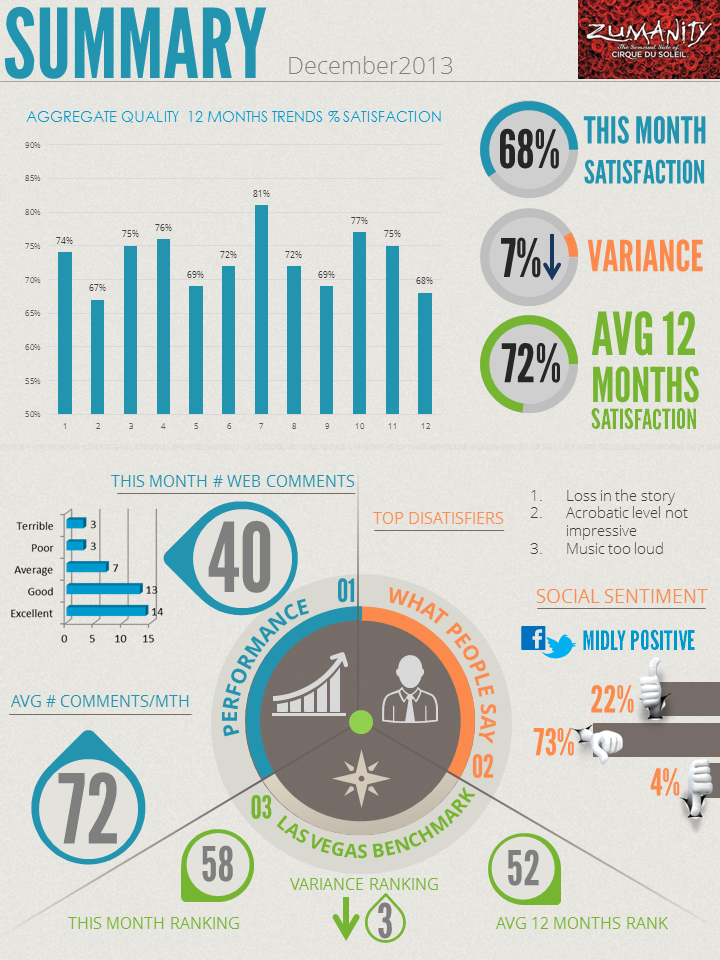
Summary
Develop an appealing report that will be produce and deliver monthly in pdf format. We made a powerpoint specification of the type of information that will be produce. Your task is to develop the layout and graphical view of the report so the information's comes out to the reader in a nice way.
Background
The report is presenting quality performance and benchmark of certain organization based on web comments and social tools posts such as twitter. Its a monthly consolidated view from different website and social sites.It provides within minutes any insight in terms of quality of product, service or even brand image.
Process
Data such as tables, graphics and other information's will be produce in excel (not part of this project)..
Once the data are available our administrator will populate the report as per the selected design. The population will be in a form of cut and paste.
The report ( See powerpoint attached)
1-The report will have 5 pages including cover page.
2-Page 1 cover , page 2 summary, page 3 Performance,page 4 benchmark, page 5 What people say
3-The report need to be customizable for different customers .It mean customer logo or images use needs to be interchangeable but without changing the overall layout.
4-You can modify the layout the way you see fit ( positionning of tables , graphs or info , font size or type, color , background etc..
5- You should propose a style of graphs that would go with the layout ( Example if we have a bar chart what kind of bar chart would look good)
Note: if to generate different graphs we need to buy a software its acceptable
6- On the benchmark page , we would like an image representation of Las Vegas strip with flag as pointer of the ranking ( see our representation)
Mises à jour
After a week, i would like to emphasize few points to all of you passionate designer looking for the wow effect !
Keep in mind that the focus is on the presentation of the data not the graphic design of the logo of the show or our logo. That is secondary.
Spend your effort of arranging the data to make them speak with image, illustration or font type or size etc.
Information vizualisation , getting the message of the page within 30 seconds,
For graph line or bar chart how could we do the in a way that the reader look at it and come with a sense of what an intersting way of presenting the data.
The Las Vegas map with the pointer of the top 10. Try to find a way of representing the top 10 of Las vegas in a way coming ut of the page so it is another WOW effect.
Thanks for your hardwork ! cant wait to see what you will come up with
Sylvain
Added Saturday, January 18, 2014
Marché(s) Cible(s)
The report will be presented to directors and executive.
Also for entertainment, artistic directors for shows will be receiving then and they do have good taste,
Secteur / Type d'entité
Software
Aspect
Chaque curseur illustre les caractéristiques de la marque client et le style que doit transmettre votre design de logo.
Élégant
Audacieux
Léger
Sérieux
Traditionnel
Moderne
Sympathique
Professionnelle
Féminin
Masculin
Coloré
Conservateur
Économique
Haut de gamme
Exigences
Doit avoir
- 1- 5 page including cover as shown in the powerpoint
2- Easy to cut and paste from excel to the report.
Note: in Design or illustrator are acceptable as our administrator has beginner skill with the softwares.
Bien d'avoir
- You could be creative in the way showing graphics such as %