New graph look and feel for Investor slide deck
Vous souhaitez remporter un projet comme celui-ci ?
Ce client a reçu 13 designs de PowerPoint de la part de 4 designers. Il a choisi ce design de PowerPoint de Imazing comme design gagnant.
Inscrivez-vous Trouvez des Projets de Design- Garanti
-
 NZ$150
-
 13 designs
-
 4 designers
Brief de Design de PowerPoint
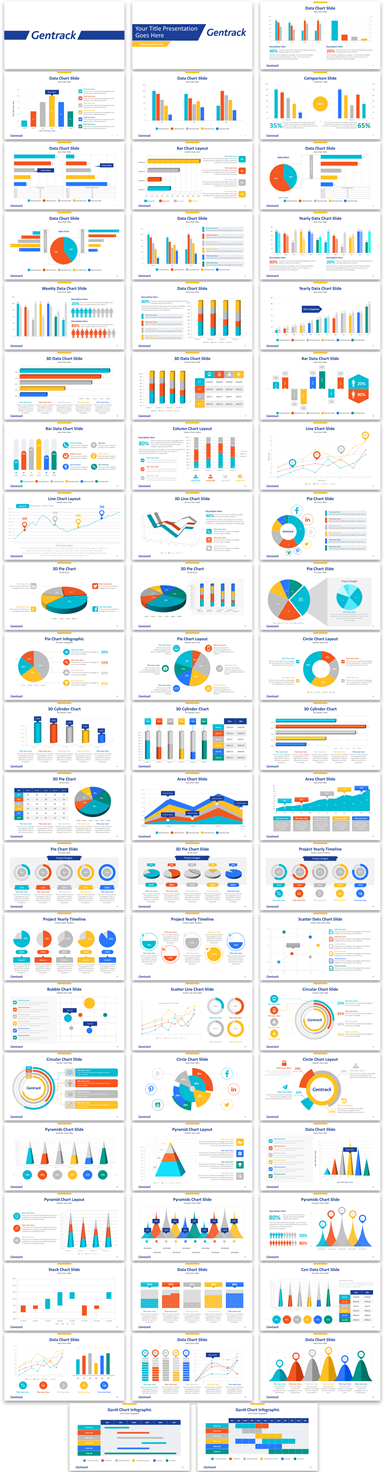
Gentrack is currently building a slide deck for its upcoming investor roadshow. This deck include a number of key business metrics - predominantly financial metrics like revenue, profit, % growth and headcount #. See gentrack.com for an idea of the current graphs used in our Investor presentations.
We are now looking for a major refresh of the look and feel of our graphs used in the investor slide deck. They need to be modern and warm. Not just something out of Excel. Presenting revenue and profit figures in $. A suite of bar charts, pie charts and line graphs for use in ppt would be superb.
Marché(s) Cible(s)
Investment analysts and advisors
Investors
Secteur / Type d'entité
Business Software
Styles de police à utiliser
Couleurs
Le designer choisit les couleurs à utiliser dans le design.
Aspect
Chaque curseur illustre les caractéristiques de la marque client et le style que doit transmettre votre design de logo.
Élégant
Audacieux
Léger
Sérieux
Traditionnel
Moderne
Sympathique
Professionnelle
Féminin
Masculin
Coloré
Conservateur
Économique
Haut de gamme
Exigences
Doit avoir
- Options for bar, line and pie graphs. Also use of bar and lines in a single graph.
- Slides should have a white to minimise print resources for investors and analysts shluld they print the slide deck.
Bien d'avoir
- Warm colours. Modern look and feel. Alignment with tech look and feel
- We provide software for utilities and airports.
Ne doit pas comporter
- Avoid excel graph look and feel.